
One of the more interesting things one can do with Python is manipulate and plot data. However, before doing either, it is often a good idea to take a look at the data you’re working with.
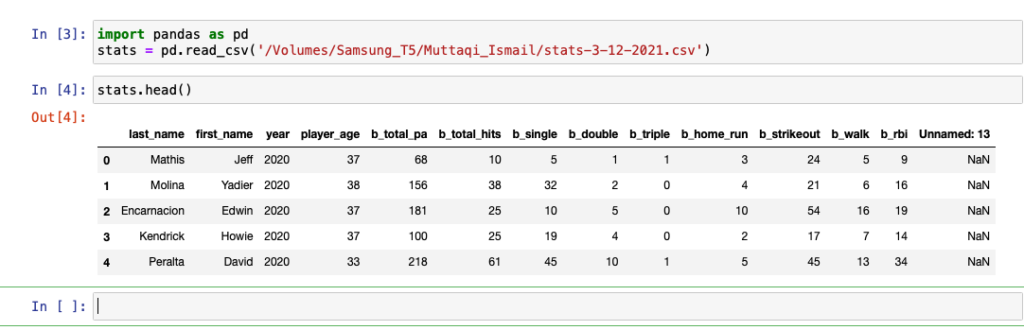
In the example below, we begin by importing the Pandas package. Then we read a CSV file off my hard drive that contains batting data from the 2020 baseball season.
Head and Tail Tags
Once the data is available, we use the .head() tag to take a look at the first five rows of data.
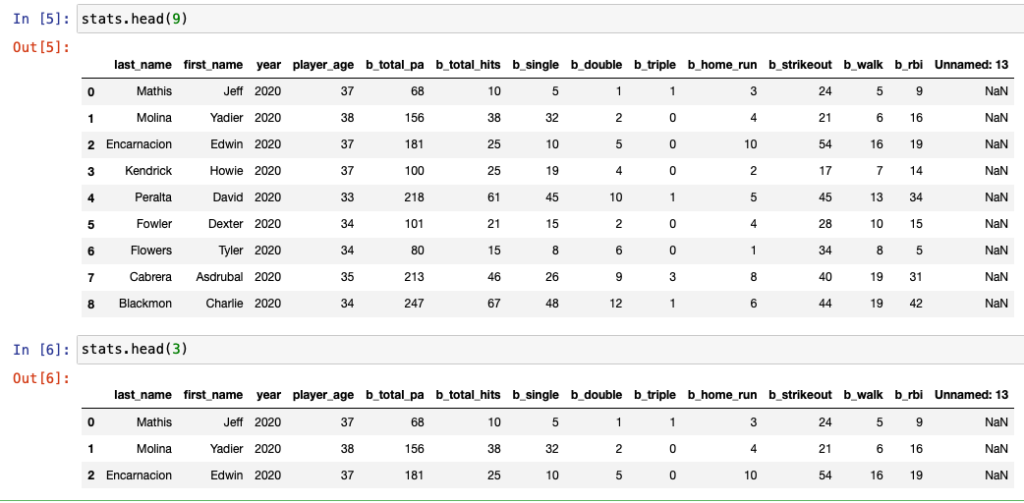
If you want to look at more (or less) rows of data, simply insert the desired number in the .head() as shown below.
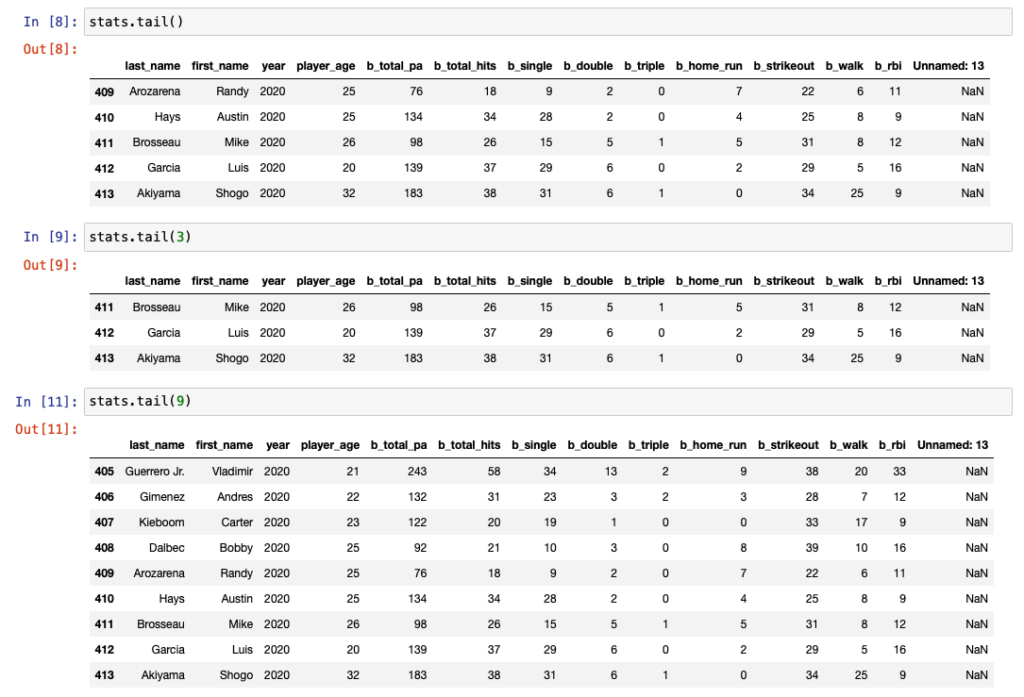
To look at the last five rows in the file, use the .tail() tag instead.
Describe tag
The .describe() tag will give you a general overview of the data in the file.
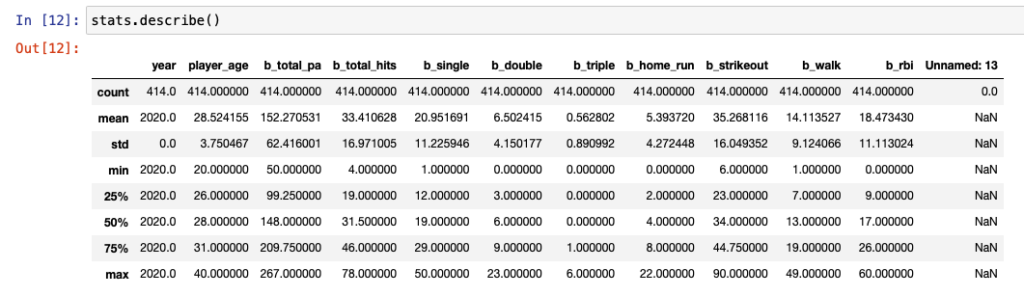
The information provided is as follows:
- Count: Number of rows
- Mean: The mean (average) of each column
- Std: Standard deviation of each column
- Min: Smallest number in each column
- 25%: Average of the first 25 percentile
- 50%: Average of the first 50 percentile
- 75%: Average of the first 75 percentile
- Max: Largest number in each column